


On May 4, Department of Homeland Security Press Secretary Tyler Q. Houlton released the following statement on U.S. Customs and Border Protection’s (CBP) Southwest Border Migration numbers for April:
“The recently released April 2018 Southwest Border Migration numbers underscore the continuing security crisis along our southwest border.”
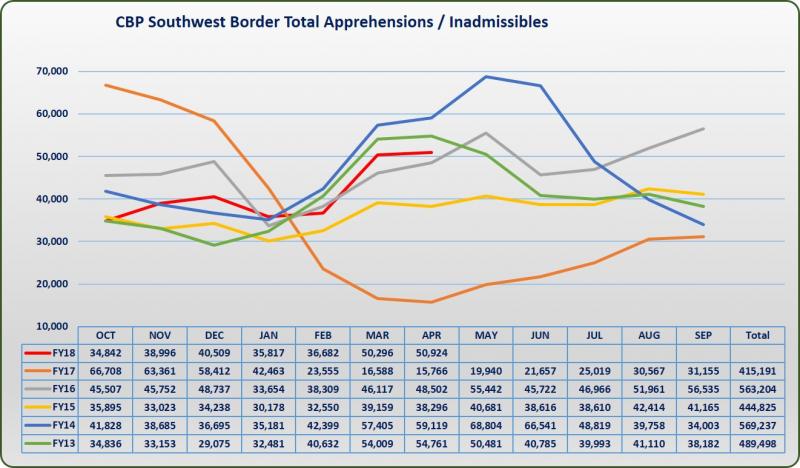
“The number of illegal border crossers increased in April from the previous month, and more than tripled in April 2018 in comparison to April 2017.”

“For the second month in a row, we have seen more than 50,000 individuals try to illegally enter the United States.”
“If you enter our country illegally, you have broken the law and will be referred for prosecution.”
“DHS has zero tolerance for those who break the law and will no longer exempt classes or groups of individuals from prosecution.”
“Whether you are a single adult or an adult member of a family unit, if you are apprehended you will be prosecuted and put in removal proceedings.
“DHS has significantly increased our referral rates to the Department of Justice for illegal border crossers when compared to the same time period in FY 2017.”
“DHS and DOJ have taken recent steps to surge the necessary resources – such as asylum officers, immigration judges, prosecutors, and ICE attorneys – to promptly adjudicate cases through our civil immigration system or through criminal prosecution.
“To those seeking to abuse our generous laws – we are watching. We will not sit back and watch our laws exploited.”
“If you make a false immigration claim, you will be referred for prosecution. If you assist or coach individuals in making false immigration claims, you will be referred for prosecution.”
(Former ICE agent David Ward on the migrants waiting near the Mexican border to seek asylum in the U.S. Courtesy of Fox Business and YouTube. Posted on May 1, 2018)
Southwest Border Migration FY2018
During the month of April, CBP saw a slight increase overall when compared to March, but a 223 percent increase compared to April 2017.
The number of Family Units increased by 8 percent and the number of unaccompanied children (UAC) increased by 2 percent compared to last month.
U.S. Border Patrol Apprehensions FY2018 YTD (October 1 – April 30)
| USBP | Demographic | OCT | NOV | DEC | JAN | FEB | MAR | APR | Total |
|---|---|---|---|---|---|---|---|---|---|
| SW Border | UAC | 3,153 | 3,977 | 4,066 | 3,211 | 3,127 | 4,153 | 4,314 | 26,001 |
| Family Units | 4,837 | 7,016 | 8,120 | 5,654 | 5,475 | 8,873 | 9,647 | 49,622 | |
| SW Border Total Apprehensions | 25,482 | 29,084 | 28,998 | 25,978 | 26,662 | 37,383 | 38,234 | 211,821 | |
Tables are accurate as of 5/1/18, totals change as data is adjudicated.
In April a total of 38,234 individuals were apprehended between ports of entry on our Southwest Border, compared with 37,383 in March and 26,662 in February.
In Fiscal Year (FY) 2017, USBP apprehended 303,916 individuals along our Southwest Border, compared to 408,870 in FY16, 331,333 in FY15, and 479,371 in FY14.
For breakdown by Sector, visit USBP Southwest Border Apprehensions by Sector
Office of Field Operations Inadmissibles FY2018 YTD (October 1 – April 30)
| Field Operations | Demographic | OCT | NOV | DEC | JAN | FEB | MAR | APR | Total |
|---|---|---|---|---|---|---|---|---|---|
| SW Border | UAC | 629 | 672 | 905 | 686 | 587 | 1,057 | 1,015 | 4,605 |
| Family Units | 3,230 | 3,680 | 4,906 | 3,562 | 3,941 | 5,162 | 5,445 | 24,446 | |
| SW Border Total Inadmissibles | 9,360 | 9,912 | 11,511 | 9,839 | 10,020 | 12,913 | 12,690 | 63,556 | |
Tables are accurate as of 5/2/18, totals change as data is adjudicated.
In April, 12,690 people presenting themselves at ports of entry on the Southwest Border were deemed inadmissible compared to 12,913 in March, and 10,020 in February.
In FY 2017 111,275 individuals were deemed inadmissible compared to 150,825 in FY16, 114,486 in FY15 and 90,601 in FY14.
OFO inadmissibility metrics include: individuals encountered at ports of entry who are seeking lawful admission into the United States but are determined to be inadmissible, individuals presenting themselves to seek humanitarian protection under our laws; and individuals who withdraw an application for admission and return to their countries of origin within a short timeframe.
For breakdown by Field Office, visit Southwest Border Inadmissibles by Field Office
CBP Enforcement Statistics FY2018
U.S. Customs and Border Protection is the nation’s largest federal law enforcement agency charged with securing the nation’s borders and facilitating international travel and trade.
Their top priority is to keep terrorists and their weapons from entering the United States.
At the nation’s more than 300 ports of entry, CBP officers have a complex mission with broad law enforcement authorities tied to screening all foreign visitors, returning American citizens and imported cargo that enters the U.S. Along the nation’s borders, the United States Border Patrol and Air and Marine Operations are the uniformed law enforcement arms of CBP responsible for securing U.S. borders between ports of entry.
The following is a summary of CBP enforcement actions related to inadmissibles, apprehensions, arrests of individuals with criminal convictions and individuals who have been apprehended multiple times crossing the border illegally.
TOTAL CBP ENFORCEMENT ACTIONS
Numbers below reflect FY2016 and FY2017 totals, FY2018TD (October 1, 2017 – April 30, 2018)
| FY2016 | FY2017 | FY2018TD | |
|---|---|---|---|
| OFFICE OF FIELD OPERATIONS (OFO) | |||
| Total Inadmissibles1 | 274,821 | 199,844 | 133,370 |
| U.S. BORDER PATROL | |||
| Total Apprehensions2 | 415,816 | 310,531 | 215,864 |
| Total Enforcement Actions | 690,637 | 487,481 | 349,234 |
1Inadmissibles refers to individuals encountered at ports of entry who are seeking lawful admission into the United States but are determined to be inadmissible, individuals presenting themselves to seek humanitarian protection under our laws, and individuals who withdraw an application for admission and return to their countries of origin within a short timeframe.
2Apprehensions refers to the physical control or temporary detainment of a person who is not lawfully in the U.S. which may or may not result in an arrest.
ARRESTS OF INDIVIDUALS WITH CRIMINAL CONVICTIONS OR THOSE WANTED BY LAW ENFORCEMENT
Numbers below reflect FY2016-2017 totals, FY2018TD (October 1, 2017 – April 30, 2018)
| FY2016 | FY2017 | FY2018TD | |
|---|---|---|---|
| OFFICE OF FIELD OPERATIONS | |||
| Criminal Aliens3 Encountered | 14,090 | 10,596 | 6,495 |
| NCIC4 Arrests | 8,129 | 6,966 | 4,443 |
| U.S. BORDER PATROL | |||
| Criminal Aliens3 Encountered | 12,842 | 8,531 | 4,480 |
| Criminal Aliens with Outstanding Wants or Warrants | 3,697 | 2,675 | 1,527 |
3Criminal Aliens refers to aliens who have been convicted of crime, whether in the United States or abroad, so long as the conviction is for conduct which is deemed criminal by the United States. Criminal aliens encountered at ports of entry are inadmissible, absent extenuating circumstances, and represent a subset of total OFO inadmissibles. U.S. Border Patrol arrests of criminal aliens are a subset of total apprehensions.
See U.S. Border Patrol Criminal Alien Statistics for a breakdown of criminal alien stats by type of conviction.
4NCIC (National Crime Information Center) arrests refers to the number of CBP arrests of individuals, including U.S. citizens, who are wanted by other law enforcement agencies.
Office of Field Operations Drug Seizures (to April 30, 2018)
| FY2012 | FY2013 | FY2014 | FY2015 | FY2016 | FY2017 | FY2018TD | |
|---|---|---|---|---|---|---|---|
| Cocaine | 45,260 | 39,075 | 41,312 | 38,145 | 52,803 | 56,729 | 37,453 |
| Heroin | 3,780 | 3,990 | 4,314 | 5,530 | 4,223 | 3,626 | 2,746 |
| Marijuana | 522,614 | 469,995 | 437,950 | 602,795 | 515,382 | 338,676 | 188,747 |
| Methamphetamine | 14,131 | 20,739 | 23,234 | 29,001 | 37,704 | 44,065 | 39,533 |
| Fentanyl | n/a | n/a | n/a | n/a | 440 | 951.54 | ** 934 |
*weights are in pounds(lb)
** Fentanyl statistics reflected here are through March 31. April totals will be provided next month.
U.S. Border Patrol Drug Seizures (to April 30, 2018)
| FY2012 | FY2013 | FY2014 | FY2015 | FY2016 | FY2017 | FY2018TD | |
|---|---|---|---|---|---|---|---|
| Cocaine | 12,161 | 4,696 | 4,554 | 11,220 | 5,473 | 9,346 | 3,692 |
| Heroin | 430 | 576 | 606 | 518 | 566 | 953 | 273 |
| Marijuana | 2,299,864 | 2,430,123 | 1,922,545 | 1,538,307 | 1,294,052 | 861,231 | 327,959 |
| Methamphetamine | 3,715 | 3,580 | 3,930 | 6,443 | 8,224 | 10,328 | 6,116 |
| Fentanyl | n/a | n/a | n/a | n/a | n/a | 181 | 284 |
*weights are in pounds(lb)
USBP Nationwide Apprehensions by Gang Affiliation
FY2014 – FY2018TD through April 30, 2018
| Gang Affiliation | FY2014 | FY2015 | FY2016 | FY2017 | FY2018TD |
|---|---|---|---|---|---|
| 18th Street | 96 | 84 | 47 | 61 | 65 |
| Angelino Heights Sureno 13 | 0 | 0 | 0 | 1 | 0 |
| Bandidos | 1 | 0 | 0 | 0 | 0 |
| Barrio Azteca | 7 | 6 | 4 | 3 | 0 |
| Border Brothers | 0 | 0 | 0 | 0 | 0 |
| Brown Pride | 0 | 0 | 0 | 0 | 0 |
| Folk Nation | 0 | 0 | 0 | 0 | 0 |
| Hard Times 13 | 0 | 0 | 1 | 0 | 0 |
| Hells Angels | 0 | 0 | 1 | 0 | 0 |
| Hermanos Pistoleros Latinos (HPL) | 2 | 2 | 0 | 3 | 2 |
| Latin Kings | 17 | 16 | 18 | 6 | 5 |
| Los Zetas | 0 | 0 | 1 | 0 | 0 |
| MS-13 | 437 | 335 | 253 | 228 | 227 |
| Mara-R | 0 | 0 | 0 | 1 | 0 |
| Maravilla Salva Trucha | 0 | 0 | 1 | 0 | 1 |
| Mexican Mafia | 3 | 4 | 6 | 4 | 3 |
| Mexicles | 0 | 0 | 0 | 0 | 0 |
| Mexikanemi | 7 | 2 | 0 | 3 | 0 |
| Nortenos | 13 | 14 | 5 | 6 | 4 |
| Other | 183 | 154 | 136 | 90 | 50 |
| Outlaws | 1 | 0 | 0 | 0 | 0 |
| Paisas | 86 | 73 | 119 | 53 | 37 |
| Partido Revolucionario Mexican (PRM) | 0 | 0 | 0 | 0 | 0 |
| Playboys | 0 | 0 | 1 | 0 | 0 |
| South Los | 1 | 0 | 0 | 0 | 0 |
| Surenos (sur-13) | 160 | 140 | 90 | 66 | 36 |
| Tango Blast | 18 | 14 | 16 | 8 | 4 |
| Texas Syndicate | 2 | 0 | 3 | 1 | 1 |
| West Park | 0 | 0 | 0 | 1 | 0 |
| Zetas | 0 | 0 | 0 | 1 | 1 |
| Total | 1,034 | 844 | 702 | 536 | 436 |
U.S. Border Patrol Recidivism Rates
| FY13 | FY14 | FY15 | FY16 | FY17 | |
| Recidivism5 | 16% | 14% | 14% | 12% | 10% |
5Recidivism refers to percentage of individuals apprehended more than one time by the Border Patrol within a fiscal year.
Visit CBP’s Southwest Border Migration page for demographic information regarding apprehensions and inadmissibles on the southwest border and the Use of Force page for use-of-force statistics and case summaries.


